
How to Use Data Dashboards to Run a Business More Clearly
Most businesses already have data. The problem is that it is scattered across CRM tools, finance sheets, website analytics, operations systems, inboxes, and weekly reports. A good dashboard turns that noise into a shared operating view.
Direct answer: how dashboards help you run a business clearly
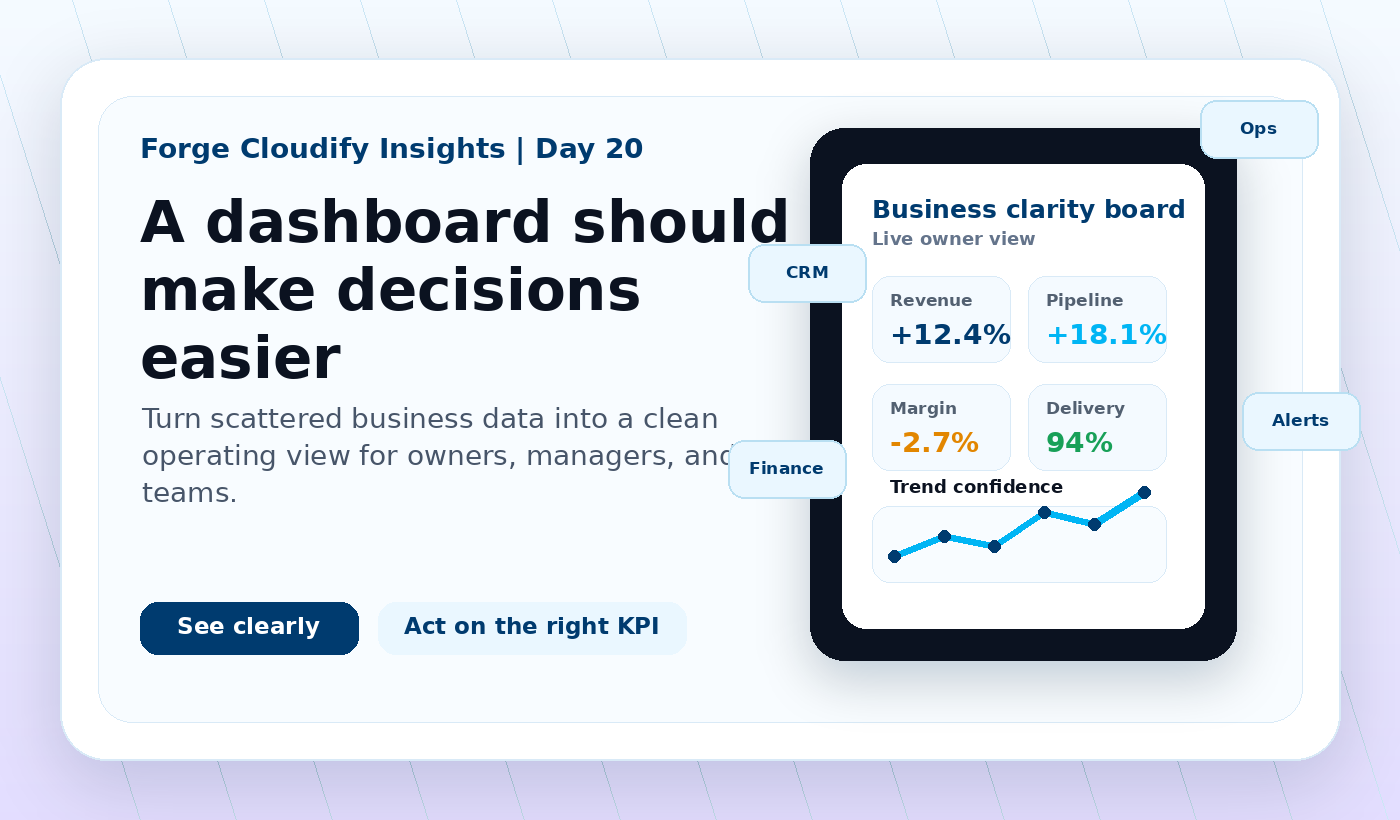
Business dashboards help leaders run a company more clearly by turning scattered data into a focused view of KPIs, trends, risks, and next actions. The best dashboards connect reliable data sources, show only decision-ready metrics, separate strategic and operational views, and make ownership obvious.
A dashboard is not a prettier spreadsheet
A spreadsheet can store data. A dashboard should help a business decide. That difference matters. If a founder, operations lead, sales manager, or finance owner opens a dashboard and still has to ask “so what?”, the dashboard is probably reporting activity rather than guiding management.
Forge Cloudify’s view is that dashboard development starts with the decisions the business repeats every week. Which leads need attention? Which projects are slipping? Which products are profitable? Which support issues are growing? Which channels are wasting spend? Once those questions are clear, the design and engineering work becomes much sharper.
What a useful business dashboard needs
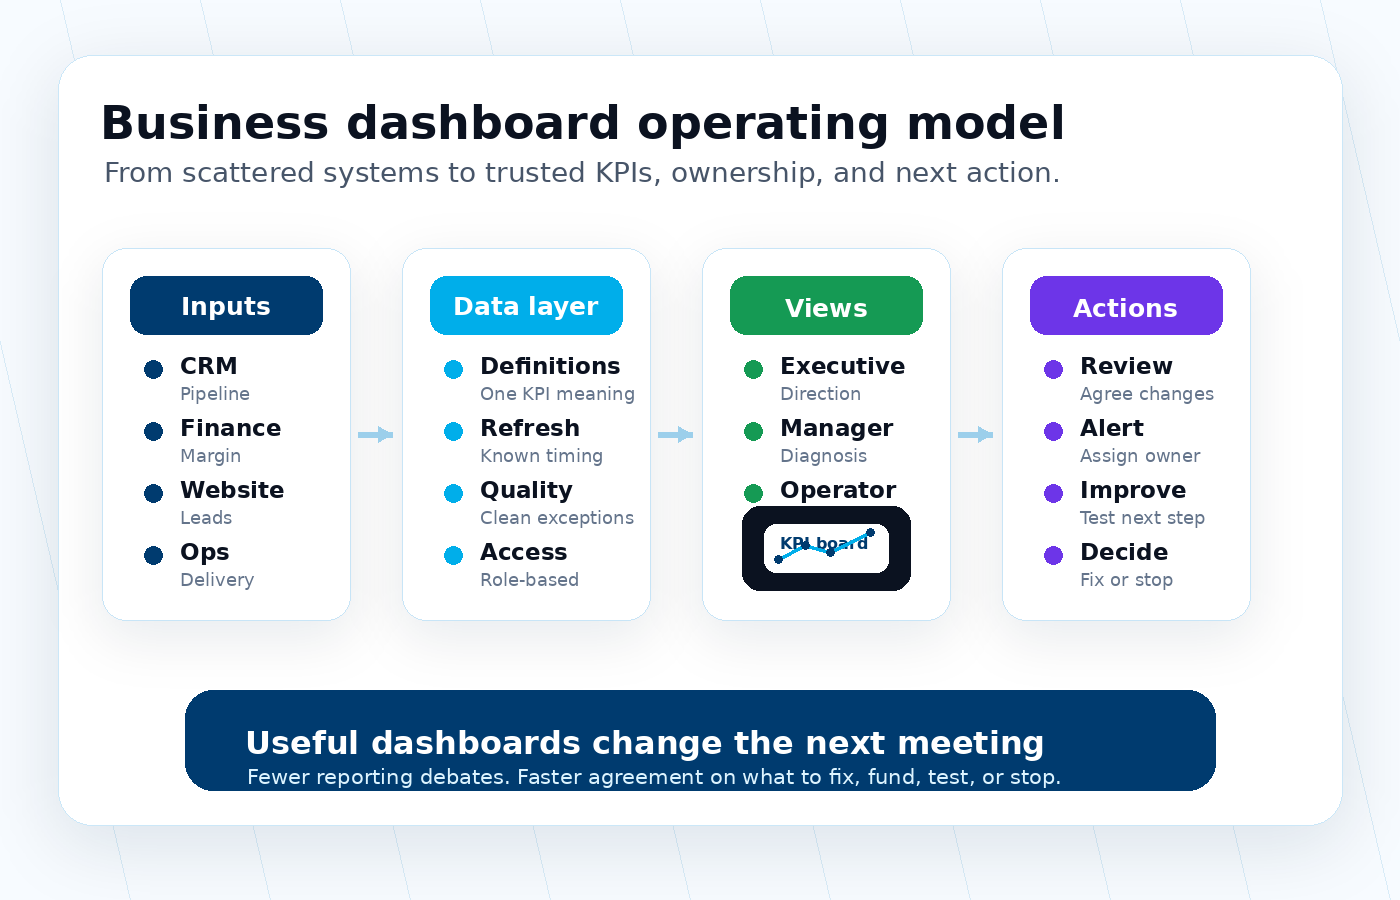
Decision-ready KPIs
Start with the numbers that affect action: revenue, margin, pipeline, delivery health, churn risk, stock pressure, lead quality, or support load. Avoid filling the first screen with vanity metrics.
Reliable data sources
Connect the right systems and define refresh rules. A dashboard loses trust quickly when CRM stages, finance totals, website conversions, or delivery statuses disagree without explanation.
Clear metric definitions
Agree what each KPI means. “Active customer”, “qualified lead”, “gross margin”, “late project”, and “resolved ticket” should not change depending on who exports the report.
Role-based views
Executives need direction, managers need diagnosis, and operators need current work. One overloaded dashboard rarely serves all three well.
Alerts and ownership
The best dashboards show who owns a number, when it last changed, what threshold matters, and what should happen when performance moves outside range.
Drill-down paths
Top-level KPIs should lead to the underlying customers, products, regions, campaigns, projects, or teams so people can investigate without starting from scratch.
Dashboard build checklist
Forge Cloudify’s dashboard development process
A dashboard project should feel like building an operating system for business clarity, not decorating reports. The engineering work matters, but the real value comes from sharper decisions and less manual reporting.
Map the business questions
We identify the decisions, meetings, roles, and performance questions the dashboard needs to support before designing screens.
Connect and clean data
We connect CRM, finance, website, operations, support, product, or spreadsheet sources and resolve definitions, refresh rules, duplicates, and access needs.
Design the operating view
We create focused dashboard screens with KPI hierarchy, trends, comparisons, filters, drill-downs, alerts, and clear visual hierarchy.
Improve through real use
We test the dashboard in actual reviews, remove unused noise, add missing context, and help teams turn insights into repeatable action.
BI tool dashboard vs custom dashboard
| Option | Best fit | Watch out for |
|---|---|---|
| BI tool dashboard | Internal reporting, fast analysis, finance packs, leadership views, and teams already using tools such as Power BI, Looker Studio, Tableau, or Metabase. | Can become a chart library with weak ownership if metric definitions, access, and review habits are not managed. |
| Custom dashboard | Dashboards inside SaaS products, customer portals, internal web apps, operational command centres, or workflows that need actions and integrations. | Needs stronger product thinking, permissions, data engineering, and support planning so it stays useful after launch. |
| Hybrid approach | A BI tool handles analysis while a custom portal gives teams or customers a simpler operational view. | Requires disciplined data modelling so numbers stay consistent across both experiences. |
Common dashboard mistakes
The most common mistake is trying to show everything. A dashboard with twenty charts can feel impressive in a demo but become ignored in real work. Other issues include stale data, unclear metric definitions, too much colour, no owner for each KPI, and no link between a red number and a practical next action.
A better approach is to build a small first version around one business rhythm: a weekly sales review, project delivery meeting, operations stand-up, finance check-in, customer success review, or founder dashboard. When that view is trusted, it can expand into deeper analysis and automation.
Need a dashboard your team will actually use?
Forge Cloudify can help design and build business dashboards that connect your systems, clarify KPIs, reduce manual reporting, and turn scattered data into a practical operating view.
Frequently asked questions
What is business dashboard development?
Business dashboard development is the process of designing and building a live reporting interface that connects data sources, calculates useful metrics, and presents them in a format leaders and teams can use for decisions.
What should a business dashboard include?
A useful dashboard should include a small set of decision-ready KPIs, time trends, comparisons against targets, owner or team filters, data freshness indicators, and clear drill-down paths for investigation.
Should a dashboard be custom-built or made in a BI tool?
BI tools are often fastest for internal reporting. A custom dashboard makes more sense when the experience must sit inside a product, combine unusual workflows, trigger actions, or integrate tightly with CRM, finance, operations, or customer portals.
How many KPIs should a dashboard track?
Most executive dashboards work better with fewer than a dozen top-level KPIs. Teams can still have deeper operational dashboards, but the first screen should focus on the handful of numbers that change decisions.
Can Forge Cloudify build a business dashboard?
Yes. Forge Cloudify can connect business systems, clean data flows, design KPI views, build custom dashboards, and integrate reporting into web apps, SaaS platforms, CRM workflows, or internal portals.
Related services: Software Development, AI Development, Cloud & DevOps, All Services, Project Estimate, and All Forge Cloudify Services.